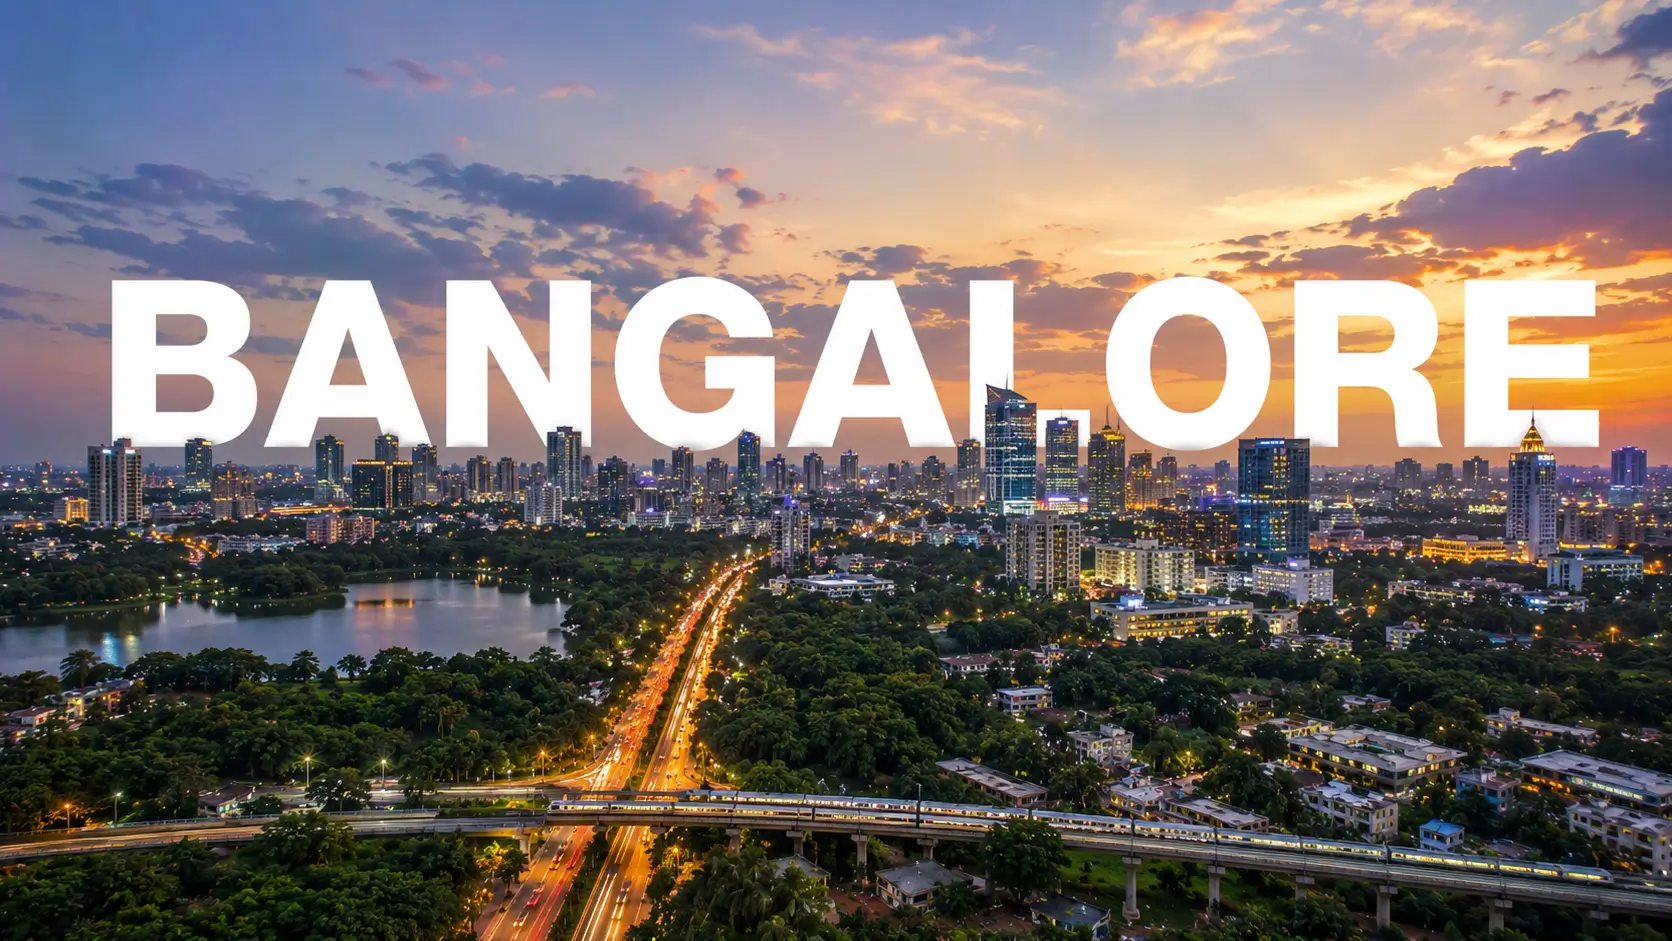
City-level narratives explain less than corridor-level numbers, which is why any answer to what is driving bangalore real estate growth in 2026...
City-level narratives explain less than corridor-level numbers, which is why any answer to what is driving bangalore real estate growth in 2026 should start with employment and infrastructure rather than sentiment. Both are measurable, and both show up in prices with a lag of a year or two.
Offices Come First
Housing demand follows workplaces everywhere in India, and Bengaluru absorbs more office space than any other city in the country. The northern quadrant has taken a large share of that over the past decade, anchored by Manyata Embassy Business Park, extended by Karle Town Centre SEZ and Bhartiya City, and supported by the airport belt beyond Yelahanka, where aerospace, logistics and technology employers keep adding capacity.
What the Corridor Numbers Show
Indicator | Figure |
|---|---|
One-year price movement, Thanisandra Main Road | 10.0% – 11.4% |
Three-year price movement | 56.5% – 57.7% |
Five-year price movement | 90.1% – 94.2% |
Ten-year price movement | 139.6% – 144.8% |
Land rates, one year | 41.7% |
Branded corridor projects | ~Rs 13,000 – Rs 16,000 per sft |
Where the Demand Comes From
Three buyer groups sustain bangalore housing demand in the northern corridors. Technology and multinational staff working at Manyata, Bhartiya City and the Hebbal cluster form the largest, buying within a commute they already know. Families upgrading from smaller homes closer to the city form the second, since the same budget buys more floor area here. Investors and overseas buyers form the third, drawn by rental demand from the first two. Those sources rarely weaken together.
Global Capability Centres
Multinationals continue to build captive operations in India, and Bengaluru hosts a large share of them. Gcc expansion in bangalore adds senior, well-paid roles rather than only volume hiring, and that profile matters to housing because such households buy larger homes and lease for longer. The effect appears first in rents near the office belts, then in purchase demand a year or two later.
Infrastructure Under Construction
Transport spending is the second engine. Outer Ring Road upgrades, the Blue Line metro along the airport corridor, the Pink Line terminus at Nagawara and continued work around the Hebbal interchange all serve the northern quadrant. Each removes minutes from a commute residents make weekly, and shorter commutes lift both rent and resale. Commissioning timelines sit with the transport authorities and should be verified rather than assumed.
The Airport Corridor Effect
Northern Bengaluru gained a second anchor when the airport opened, and the effect compounds. Employment along the belt, hotel and logistics activity, and households that fly weekly have all concentrated within a half-hour of the terminal. From the northern Thanisandra stretch, the airport sits roughly 21 km by road and KIADB Aerospace and IT Park at Bagalur about 18 km. Anyone asking what is driving bangalore real estate growth in 2026 should weigh this alongside the office belts, since few other quadrants carry two demand anchors of that size.
Supply and Price Discovery
Markets need volume to price properly. Several listed developers hold delivered or active projects along the northern corridors, which gives buyers recorded transactions to reference and a resale market with genuine depth. Rental economics complete the picture, with homes from A-class developers taken at 3.5% to 4% of property cost each year semi-furnished and 4% to 4.5% furnished.
What Could Slow It
A sustained slowdown in office absorption or technology hiring
Heavy simultaneous launches softening prices in a micro-market
Delays in metro commissioning or road capacity upgrades
Broader interest-rate cycles affecting buyer capacity
Reading It for Your Own Purchase
City trends set context; a project decides your outcome. Compare an asking rate against the corridor band, test the commute at your own hour, check the RERA registration and the progress filings, and read the cost sheet in full. Answering what is driving bangalore real estate growth in 2026 is useful mainly because it tells you which corridors have the fundamentals to keep performing.
Ask about projects on the northern corridor — Enquire Now
Related reading: Global Capability Centres and Their Impact on Bangalore Housing.
FAQs
What is driving Bangalore's property market in 2026?
Office absorption across the city, a northern quadrant anchored by Manyata, Bhartiya City and the airport belt, infrastructure under construction, and branded supply that gives buyers price discovery.How much have northern corridor prices moved?
Along Thanisandra Main Road, roughly 10.0% to 11.4% over one year, about 56.5% to 57.7% across three years and 90.1% to 94.2% over five, with land rates up around 41.7% in a year.What could slow the market?
A slowdown in office absorption or technology hiring, heavy simultaneous launches, delays in metro or road delivery, and broader interest-rate cycles.
Related Articles
Bangalore's Startup Scene and Premium Housing Demand
Wealth created by young companies eventually buys property, and Bengaluru has produced more of it than any other Indian city. The startup growth...
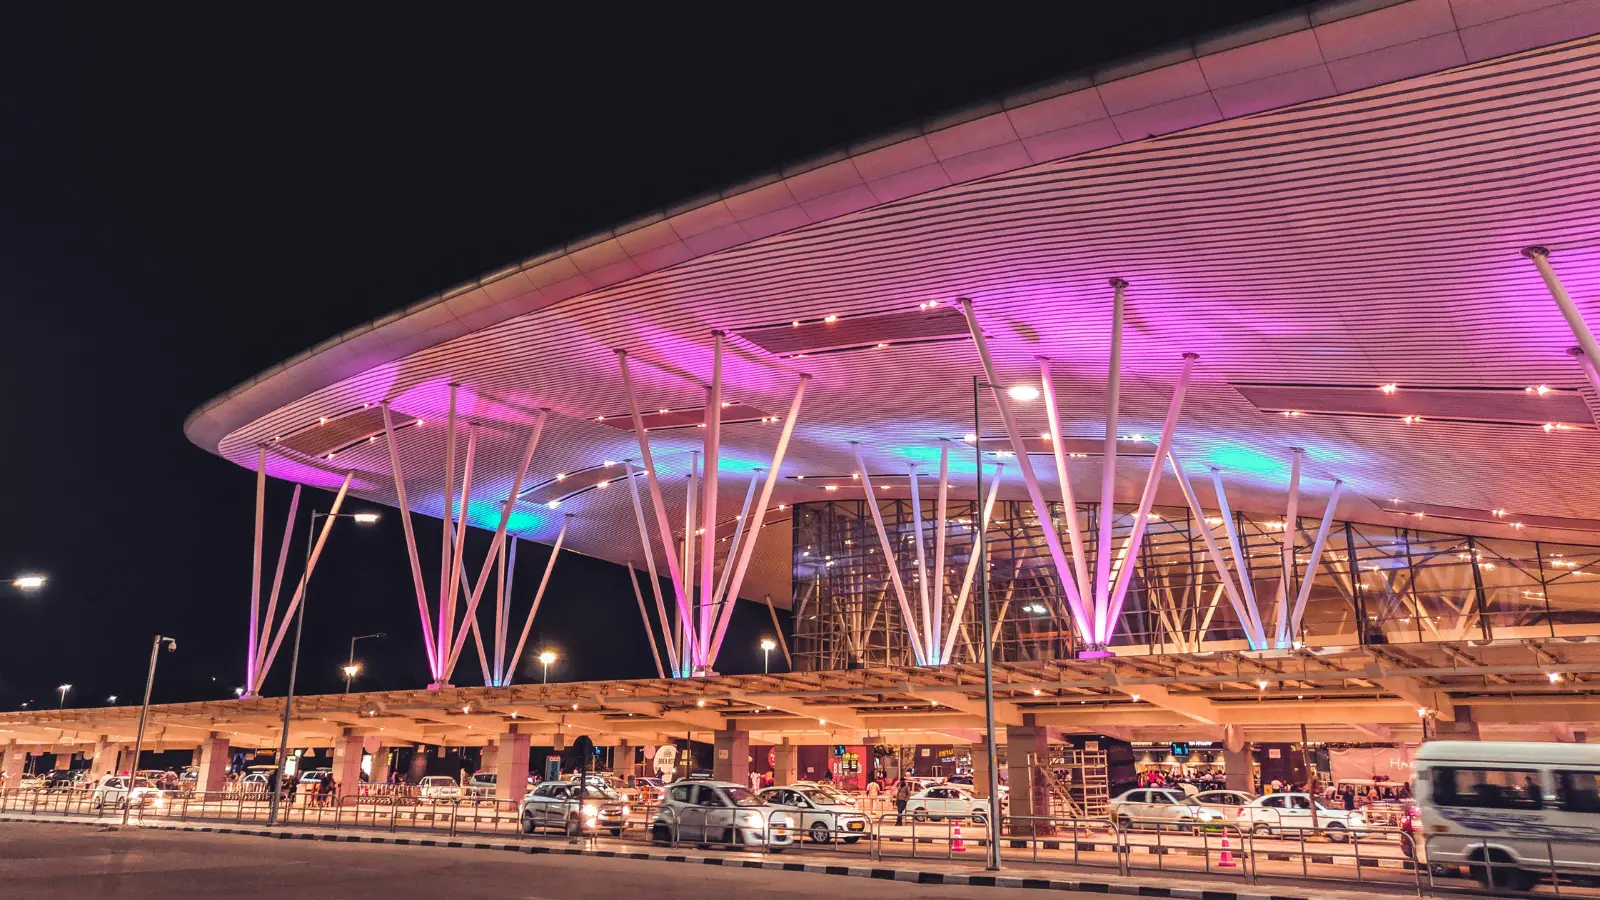
How Airport Expansion Is Reshaping North Bangalore
Airports create economies around them, not just traffic. The kempegowda airport expansion impact on property in the northern quadrant has run through...

Global Capability Centres and Their Impact on Bangalore Housing
Captive centres changed the profile of the city's office demand, and housing followed. The gcc impact on bangalore real estate is easiest to see in...
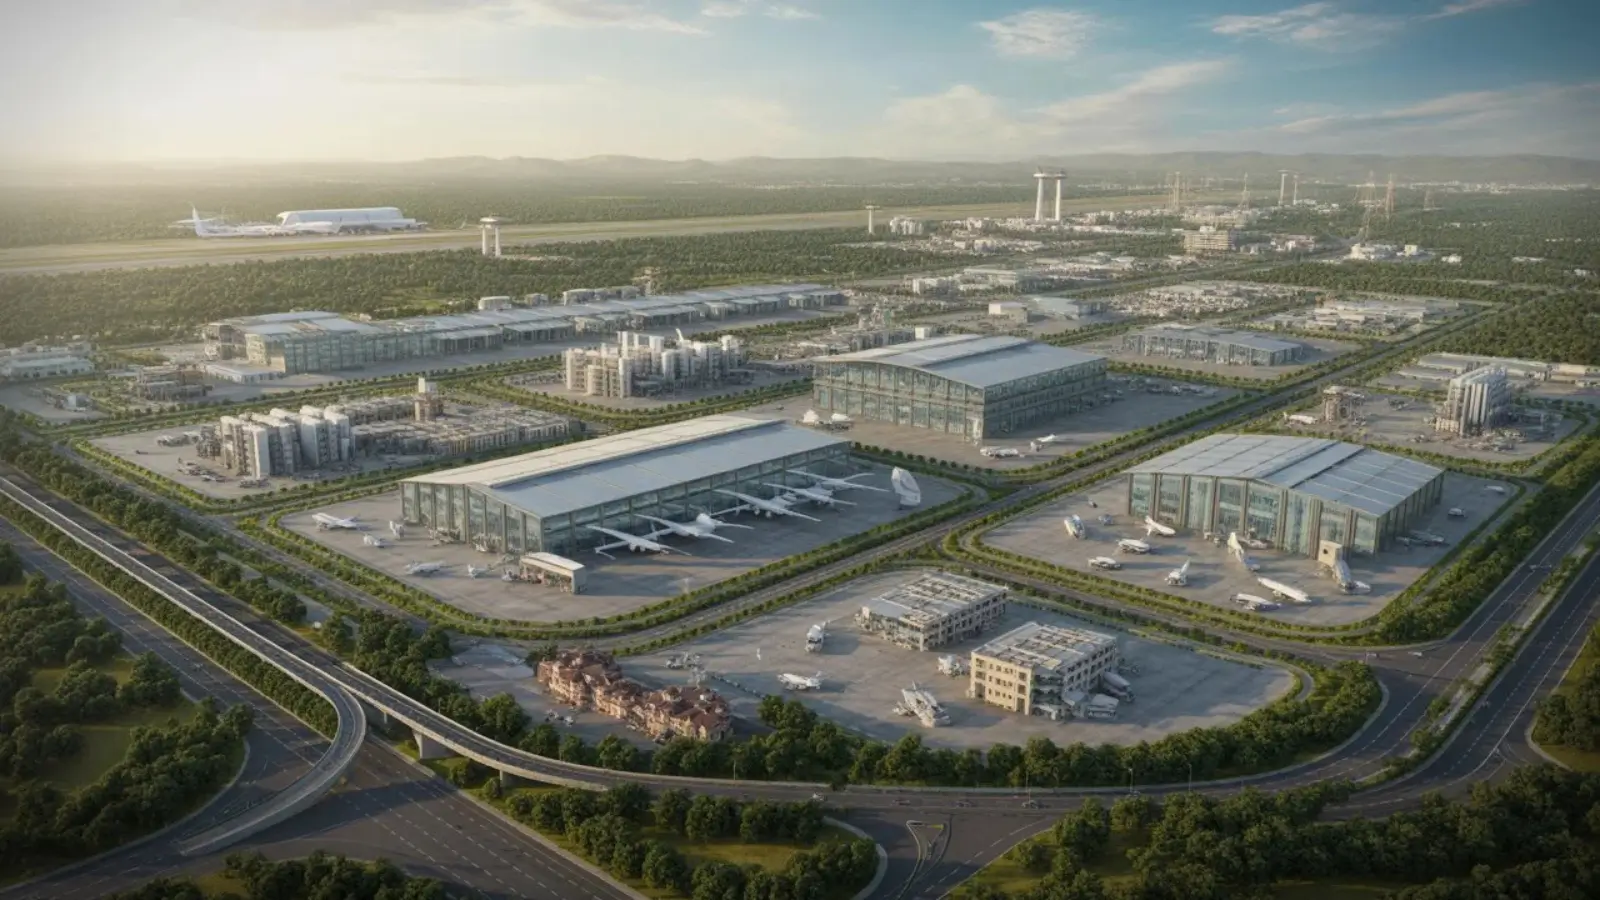
KIADB Aerospace Park and the North Bangalore Industrial Corridor
Industrial employment shapes housing demand differently from office employment, and northern Bengaluru now carries both. The kiadb aerospace park...